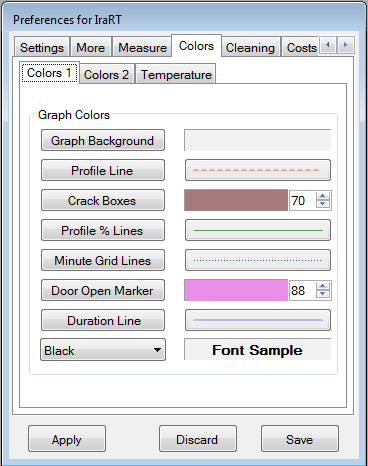
This lets you pick the colors of the lines, background and text on the graph displayed during a roast and while looking at the roast history. You can hide things by making them the same color as the background. The Colors 2 page contains additional color settings. Click the Name(left) button to set the colors and click the button with the picture of the line(right) to set the line width and style. The two numbers are for setting the transparency of those colors. Setting it to zero will make the item disappear, 100 is solid and anything in between will make the color transparent so you can see what's behind it. I have most of mine set to numbers between 40 and 60.

