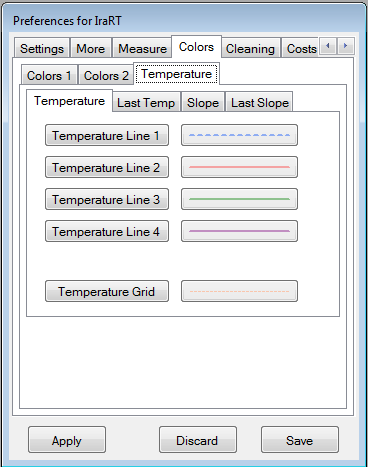
This section lets you pick the colors, widths and patterns of the lines that are used to log temperatures. Temperature lines 1-4 are the colors and patterns of the first 4 logged temperatures, past that the colors start duplicating: line 5 uses the line 1 colors etc... The buttons on the right side show what the lines will look like. Temperature Grid lets you choose the look of the horizontal lines indicating temperatures. The Other 3 tabs let you choose the look of lines for rate of rise, and the temperature and rate of rise from the duplicated roast displayed when you duplicate a roast. Click the Name to choose a line color, click the display button to choose pattern and width. When you are on the Choose a line style page, set the width and then press one of the line style buttons to choose that line style. Pressing "Back" leaves the line the way it was.
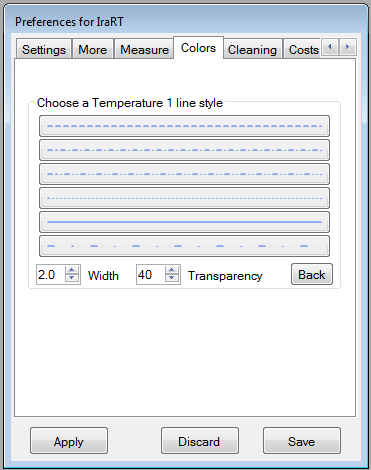
When you click on a line style button you'll get this screen where you can set line style, line width and transparency. Click the line style to select a new style or press Back to leave it as is.